The impact of the US tariffs on climate risk is not to be discounted, they will have an influence on CO2 emissions, transition risks (including carbon taxation), and physical climate risks tied to shifts in production and infrastructure.
The Trump administration's sweeping 2025 tariff policy has redefined global trade dynamics, affecting not only economic relations but also climate strategies. As countries brace for a baseline 10% US tariff on exports, with certain nations, like China, facing an average of 51.1%, the cascading impact on climate risk is becoming increasingly apparent.
Despite the recent halt of tariffs by the US Court of International Trade affecting tariffs on Canada, Mexico, China and the 10% global tariff, broader economic and business uncertainty still remains, noting that sectoral tariffs remain. The US government will appeal this decision, which may result in a lift.
Although tariffs will likely evolve in levels, sectors and countries being affected over the next few months or years, they will impact climate risk in different ways.
1. CO2 emissions levels: a shift in emission geography
Short-term reduction from decreased trade
International trade is a significant contributor to global CO2 emissions, primarily due to transportation and logistics (Scope 3 emissions). According to the International Transport Forum, maritime shipping alone accounts for nearly 3% of global emissions, and that figure rises when including aviation and land transport tied to trade. By imposing steep tariffs, the US will reduce the volume of imported goods, particularly from high-export countries like China, Germany, and Mexico. This initial contraction in international trade can lead to a short-term dip in global emissions, especially Scope 3.
The table below presents a comparative overview of the top US trading partners affected by the Trump administration’s 2025 tariff policy, focusing on their share of US imports, key industries involved, national CO2 emissions, and the primary sectors contributing to those emissions.
Chart 1: Top 5 US importers; largest sectors by importation into the US and emission
Transport (29%) Power Industry (25%) Fuel Exploitation (12%)
Mid-to-Long-Term effects: rebound in domestic emissions
However, as the US will replace imports with domestic production, emissions are likely to increase. Local manufacturing will ramp up, involving more energy-intensive processes, especially in steel, automotive, and heavy industries. Many of these sectors in the US still rely on fossil fuels, leading to a rise in scope 1 (direct emissions from owned sources) and scope 2 emissions (indirect emissions from purchased electricity and heat).
According to the Financial Times’ breakdown of tariff impacts [4], key winners include domestic steel and defence manufacturers, while losers include clean energy sectors that rely on imported components. Solar panel assembly, wind turbine parts, and electric vehicle batteries are particularly exposed. Their reliance on Chinese, Canadian, and European inputs makes them tariff-sensitive and vulnerable to delays and cost inflation. This weakens the US energy transition at a critical time. Increased costs in clean energy components may slow the deployment of renewables, thereby entrenching fossil fuel use and elevating long-term emissions.
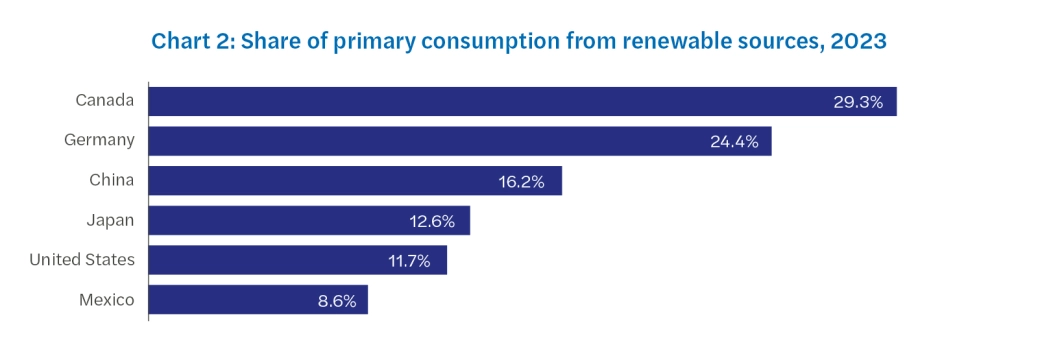
The short-term benefits from shifting production from overseas to the US could be offset if US-based manufacturing relies on more carbon-intensive energy sources. While reduced outsourcing may lower emissions in high-emitting countries like China, the overall climate impact ultimately depends on how efficiently the US can absorb this production shift. This concern is underscored by the chart below, which shows that the US has one of the lowest shares of renewable energy consumption among its top five import partners. As a result, any scope 3 emissions savings from reduced transportation could be offset by increased domestic scope 1 and 2 emissions, particularly if clean energy investments do not keep pace.
In the medium- to long-term, the impact of tariffs will depend on several factors. Whether the US economy performs well in response to the tariffs plays a significant role. If the economy underperforms, less investment will be funnelled into green energy projects giving US manufacturers fewer options to reduce their scope 1 and 2 emissions by, for example, choosing a green energy source as its supplier.
Long-term tariff impact on scope 3 emissions depends on several factors. Reshored supply chains will lead to a decrease in distribution and transportation emissions, decreasing scope 3 emissions. This must be weighed against the increase in scope 3 emissions due to employees facing fewer green commuting choices, and the downstream impact of firms who may create less climate-focused products in the absence of sufficient incentives: both long-term consequences of an economy investing less in green energy. The overall scope 3 trend is likely to be downward; transportation emissions are significant, and their reduction will likely outweigh any increase in downstream emissions.
Moreover, countries like China, despite their reliance on coal, have developed optimised and energy-efficient supply chains for industrial production. If the US relocates manufacturing without comparable infrastructure or efficiency standards, the emissions intensity per unit of output could worsen. While localised supply chains may enhance economic resilience, they risk increasing carbon intensity unless accompanied by widespread adoption of clean technologies.
Finally, the sustainability of US-based production may be inferior across the product lifecycle when compared to countries with stricter environmental regulations. For example, as illustrated in the table below, new cars manufactured in the US emit up to 60% more CO2 on average than those produced in Germany or Japan, highlighting the potential environmental trade-offs of domestic reshoring.
Chart 3: Average CO2 emissions for new cars per country
Country/Region
Average CO2 (g/km) for New Cars
Japan
120 g/km
Germany
115 g/km [6]
United States
198 g/km [7]
2. Transition risk: implications for Carbon Tax and investor perception
Carbon pricing challenges
The global shift towards carbon pricing mechanisms, including Carbon Border Adjustment Mechanisms (CBAM) in the EU, creates a tangled web of compliance. With higher domestic emissions due to reshoring, US producers may face increased regulatory scrutiny, especially if state-level carbon pricing expands or if global partners enforce climate-aligned tariffs.
Trump's tariff strategy may inadvertently isolate U.S. producers from global low-carbon incentives. The EU’s CBAM, for instance, will apply carbon tariffs on imported goods based on their embedded emissions. If the US escalates production without carbon pricing reforms, its exporters could face further penalties abroad, exacerbating transition risk.
For US manufactures, emissions related to production (scope 1) and energy use (scope 2) may experience an increase in the absence of emissions-reducing incentives. By contrast, emissions related to upstream and downstream activities (scope 3) - such as transportation and distribution - may decrease reflecting the reshored supply chain and shortened shipping process.
This may pose an increase in difficulty for US manufactures looking to obtain credit. Credit providers place focus on scope 1 and 2 emissions when assessing a company's risk profile. Though important, scope 3 emissions are less fundamental to a company's risk profile given their separation from direct activities performed by the company. Consequently, companies with increased scope 1 and 2 emissions will face difficulty obtaining credit, even if their scope 3 emissions decrease in response to tariffs.
Investor perception
Investors are increasingly prioritising ESG metrics. Tariffs that lead to higher emissions domestically may lower sustainability scores, affecting credit ratings and financing costs. As per the Task Force on Climate-related Financial Disclosures, the sectors most affected by these risks include energy, transportation, manufacturing, and agriculture. These industries are undergoing substantial transformations as they adapt to new regulations, evolving market demands, and technological advancements.
This could mean that climate misalignment can become a systemic financial risk. US industries most impacted, autos, steel, semiconductors, are also among those most exposed to climate regulation and ESG scrutiny.
3. Physical risk: supply chains vs. new asset vulnerability
Impacts of a local supply chain
One potential upside of Trump’s tariffs is a decreased reliance on vulnerable global supply chains. Disruptions from extreme weather events, such as typhoons in Southeast Asia or floods in Europe, have shown how fragile international logistics can be. By reshoring manufacturing, companies reduce their exposure to such risks.
Chart 5: Top physical risks per the top 5 US importers
Country
Top Physical Climate Risk
Estimated 2023 Physical Risk Financial Impact
Key Events (2023)
Mexico
Tropical Cyclones & Hurricanes
~$5–7 billion USD
Hurricanes and droughts caused agricultural and infrastructure losses
China
River & Urban Flooding
~$27 billion USD
Major flooding and typhoons, including $10B in July–August alone
Canada
Wildfires
~$6–8 billion USD
Wildfires and floods, with insured losses rising sharply
Germany
River Flooding
~$4–6 billion USD
River flooding and storms, though less severe than 2021
Japan
Typhoons & Storm Surges
~$15–20 billion USD
Typhoons and heavy rainfall events disrupted urban and industrial areas
However, this resilience is only partial. While transportation-related vulnerabilities may decline, the need for new physical infrastructure, factories, logistics hubs, power plants, introduces fresh exposure to domestic climate risks. For instance, new manufacturing in the US South or Midwest might face heightened risks from hurricanes or heatwaves, respectively. Recent physical hazard in the US had a significant impact of local manufacturing production and infrastructure:
Wildfires: The 2024 wildfires in California disrupted supply chains, causing delays in the production of vehicles due to damaged infrastructure and transportation networks [9].
Hurricanes: Hurricane Helene in September 2024 severely impacted manufacturing plants in the Gulf Coast, leading to temporary shutdowns and production losses in the automotive [10] and steel industries [11]. The hurricane caused widespread power outages, further disrupting manufacturing operations.
Tornadoes: The 2024 tornado season caused significant damage to industrial facilities and disrupted critical infrastructure leading to delays in the delivery of essential materials. steel manufacturing plants in the Midwest, disrupting production and leading to a temporary shortage of steel products. This had a ripple effect on construction and other industries reliant essential materials.
Flooding: Extreme rainfall in August 2024 led to catastrophic flooding in the Northeast, affecting textile manufacturing facilities and disrupting local transportation networks. This caused damage to machinery and raw materials, impacting production and distribution.
Hence, reshoring production due to Trump’s tariffs may reduce global supply chain vulnerabilities, but it increases companies’ exposure to domestic climate risks. While firms avoid disruptions from typhoons in Asia or floods in Europe, they now face rising threats from hurricanes, wildfires, tornadoes, and floods within the US In 2024 alone, these events caused an estimated $39 billion in damages, disrupting manufacturing, damaging infrastructure, and halting production. New factories and logistics hubs built in high-risk areas like the Gulf Coast or Midwest are particularly vulnerable. As a result, the physical and financial exposure of corporate assets is growing, making climate resilience a critical factor in future industrial strategy.
Impact of physical risks on creditworthiness
A Moody’s analysis indicates that physical climate risk can significantly affect creditworthiness at the asset level [12]. New facilities in high-risk zones require greater insurance premiums and may face operational disruptions from climate events. These risks need to be assessed during capital allocation, lest they undermine long-term profitability.
Besides, Moody’s recently downgraded the US's credit rating by from Aaa to Aa1 [13] driven by the growing burden of financing the federal government's budget deficit and the rising cost of rolling over existing debt amid high interest rates. This downgrade reflects concerns over the increase in government debt and interest payment ratios, which have reached levels significantly higher than those of similarly rated sovereigns. Besides, Moody’s noted that the US gross domestic product growth is likely to slow in the short term as the economy adjusts to higher tariffs.
The impact of this downgrade is multifaceted:
The downgrade is expected to lift the yield that investors demand to buy US treasury debt, reflecting more risk. This could lead to higher borrowing costs for the US government.
The downgrade may dampen sentiment toward owning US assets, including stocks, as it signals increased financial risk. In addition to a non-alignment with climate standards, this could result in an important market impact on US companies.
Net physical risk trade-off
In short, while supply chain exposure decreases, localised production reintroduces physical risk at the point of manufacture. Without climate-resilient infrastructure design, the net effect on physical climate risk might be neutral or even negative.
Industries facing both higher carbon intensity and greater climate physical risk may see increased cost of capital. Financial institutions are increasingly integrating climate scenarios into credit models. Transition and physical risks analysis are now directly impacting credit ratings, especially for mid- to long-term lending in heavy industry and manufacturing, which might be detrimental for US companies.
What it means for businesses and markets
Trump’s 2025 tariffs have set off a chain reaction across global trade, climate policy, and risk management. While the immediate effect may be a modest reduction in global shipping emissions, the mid-to-long-term impacts, higher domestic emissions, transition risk from misaligned carbon policy, and increased physical risk from new infrastructure, suggest an overall negative climate trajectory unless aggressively counterbalanced.
Policymakers and businesses must incorporate climate risk into trade strategy, pushing for decarbonised reshoring, climate-aligned industrial policy, and infrastructure investment that is both green and resilient. Otherwise, the geopolitical and economic realignment triggered by tariffs will undermine climate progress and amplify financial risk.
Financial institutions are encouraged to incorporate US tariffs’ shocks into their climate scenario analysis to fully capture the impact on financial risks, especially credit risk.
Contact our experts
Our expert teams are prepared to support you through the complexities of the US tariffs' impact on UK businesses, empowering you to make informed decisions that strengthen your operations and resilience.
After the initial agreements on trade between the US and the UK, the EU and Japan, the White House began to pursue a more product-oriented strategy, which could be more sustainable from a legal perspective. At the same time, tensions with China have been escalating, with China further cutting the supply of rare earths, following a significant reduction of orders of soybeans, with the US threatening...
We support banks, (re)insurers, building societies and other PRA-regulated firms in addressing climate risk in their risk management frameworks, from setting the right governance, coming up with a climate-resilient strategy, enforcing their risk management, and reporting on climate risk. Our analysis solutions provide support to financial services companies in climate risk evaluation, climate stress...