This section applies the framework to a diversified portfolio of companies across sectors. The analysis decomposes expected damage into chronic, acute and supply chain components, with the objective of assessing how the different physical-risk transmission channels contribute to overall company-level exposure.
4.1: Portfolio data
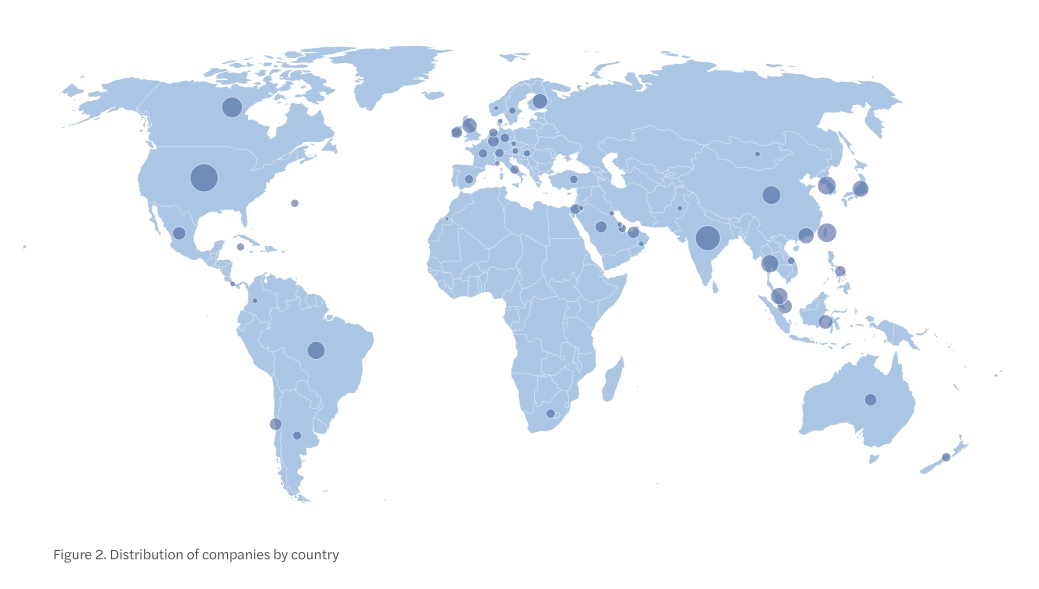
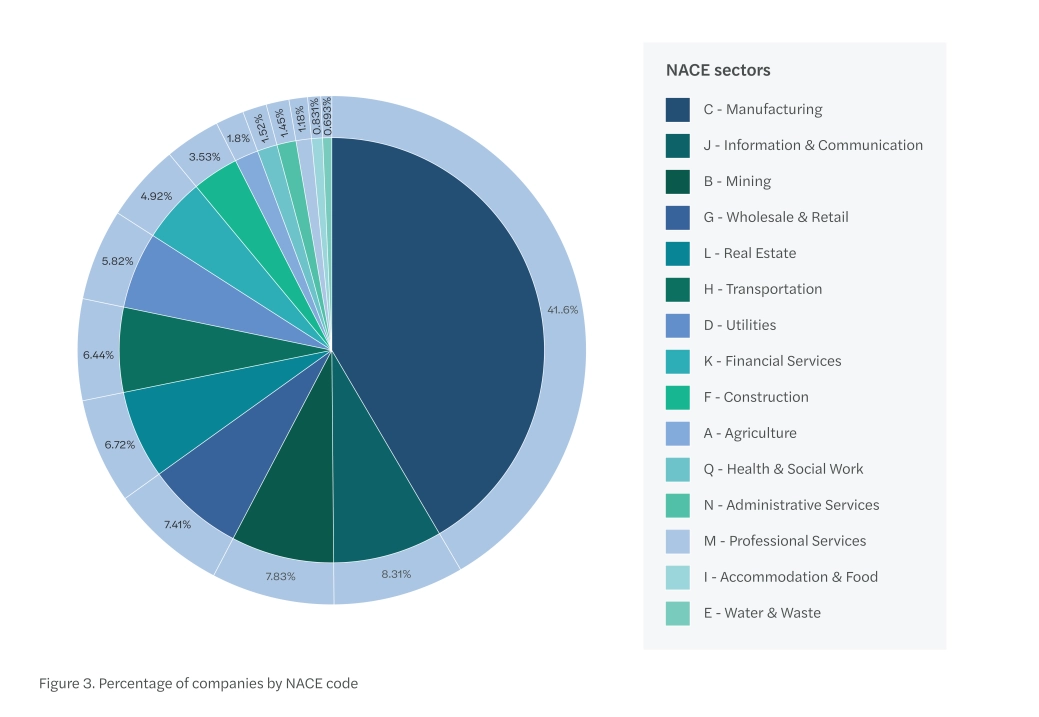
The framework described in Sections 2 & 3 is applied to a portfolio of 1,444 listed companies operating across 55 countries and spanning 15 Nomenclature of Economic Activities (NACE)[4] codes (A to Q). The distribution of companies varies by sector[5]. Manufacturing is the largest sector in the sample, representing ~42% of all firms. For each company, expected damage is expressed as a share of Earnings Before Interest, Taxes, Depreciation and Amortization (EBITDA) and decomposed into the three transmission channels: chronic, acute and supply chain.
Facility-level exposures are assessed using the company's geolocated sites. Supply chain exposure is assigned through the company's sector using the propagation methodology described in Section 3.
Results are reported for the year 2050 under RCP 4.5, a moderate emissions pathway consistent with partial mitigation. This scenario is used to provide a central view of potential exposure under a plausible climate pathway.
4.2: Study outcome
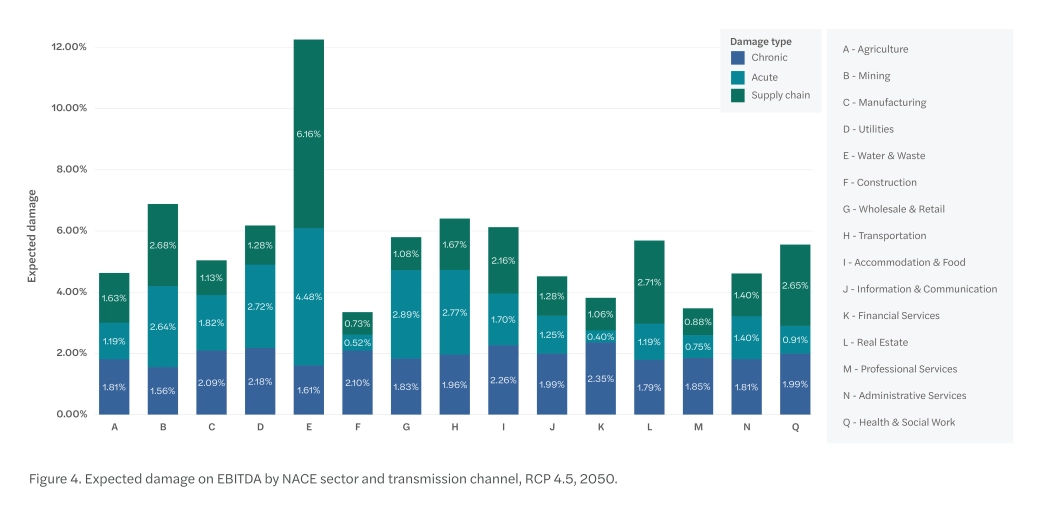
Figure 4 reports the decomposition of expected damage by sector and transmission channel. All results are expressed as a share of EBITDA, with acute and supply chain damages reported net of insurance coverage.
Excluding water and waste management (E), total expected damage ranges from 3.3% in construction (F) to 6.9% in mining and quarrying (B). Sector E records the highest values across all three channels, at 12.3% in total, but it rests on around ten companies, and its results should be read as indicative only.
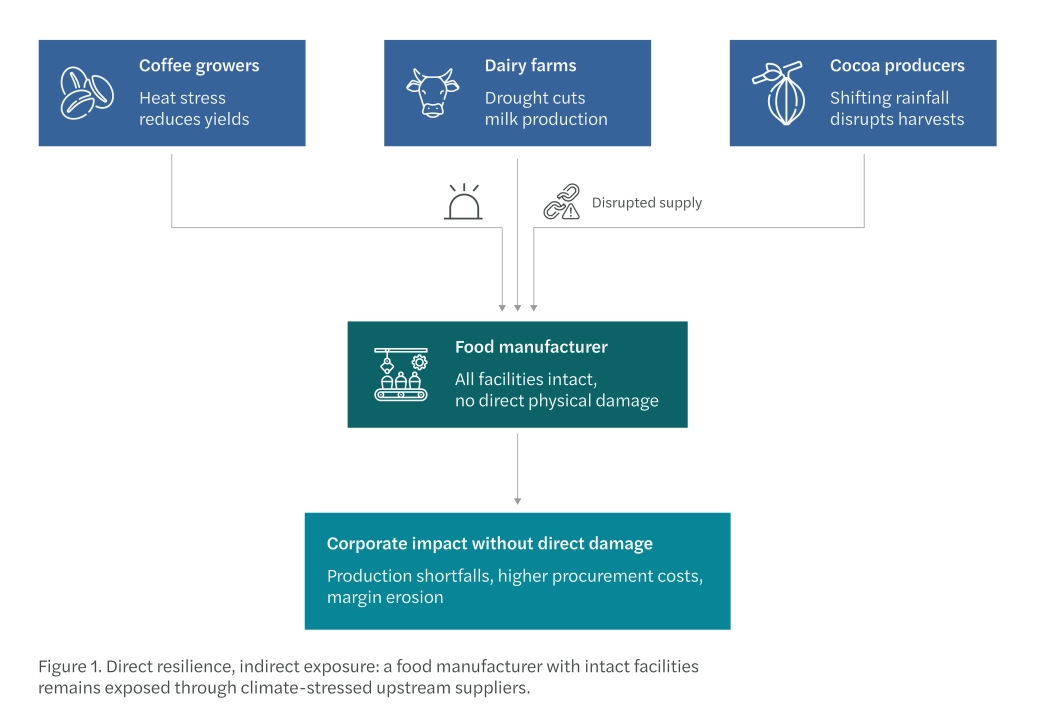
Before reviewing the sector-level results, it is useful to return to the food manufacturer example introduced in Figure 1. Manufacturing (C), the largest sector in the portfolio, illustrates the interaction between direct and indirect physical-risk channels. Direct exposure accounts for the bulk of expected damage, with chronic risk at 2.1% and acute risk at 1.8%. The supply chain component adds a further 1.1%, more than a fifth of the sector's total expected damage. For manufacturers that depend on climate-sensitive commodities or intermediate goods, such as the food manufacturer of Figure 1, this share is likely to be structurally higher than the sector average suggests.
For these companies, the availability of inputs is a source of risk that no investment in the resilience of their own facilities can address.
Three patterns stand out from Figure 4:
First, chronic risk represents a common baseline across sectors. Across the fifteen sectors in the portfolio, the chronic component lies within a narrow range, between 1.6% and 2.4%. This reflects the fact that chronic risk is driven by the countries in which companies operate, weighted by their asset footprint. In this portfolio, sector-level geographic exposures are sufficiently similar for chronic risk to form a relatively stable component of expected damage across sectors.
Second, acute risk varies more materially across sectors. The damage ranges from 0.4% in financial services (K) to 2.9% in wholesale and retail trade (G), with transportation and storage (H, 2.8%), utilities (D, 2.7%) and mining and quarrying (B, 2.6%) close behind. These sectors hold physical assets that are capital-intensive, location-constrained and difficult to relocate, such as ports, rail networks, mines, and power and water infrastructure. Wholesale and retail trade follows the same logic. Its operations run through large distribution centres, warehouses and dense store networks, often located in low-lying logistics hubs close to transport corridors. For these sectors, direct facility-level exposure accounts for a large share of total expected damage, and conventional asset-level assessment captures an important part of their physical risk profile.
Third, the supply chain channel is material in almost every sector, not only in asset-light activities. It exceeds direct acute damage in many sectors. Even in mining (B), one of the most asset-intensive sectors in the portfolio, indirect exposure (2.7%) is on a par with direct damage (2.6%). This reflects the sector's dependence on energy, heavy equipment and transport services.
At first sight, information and communication (J) and financial services (K) might appear only marginally exposed to physical climate risk. Unlike manufacturers, utilities or transport operators, they own relatively few climate-sensitive facilities, and a facility-level assessment therefore suggests limited vulnerability. Yet this intuition proves misleading. In information and communication (J), supply chain damage slightly exceeds direct acute damage (1.3% against 1.2%). In financial services (K), the ratio is more than two and a half to one (1.1% against 0.4%). These results highlight that physical risk does not depend solely on the fixed assets a company owns, but also on the sectors it depends on. For example, companies in information and communication (J) often depend on a network of enabling infrastructure and inputs, including electricity supply, data centres and digital infrastructure. Climate-related disruption affecting these inputs or service providers can affect the continuity and capacity to operate, even if a company's own offices and facilities are not directly exposed. The sector's supply chain impact, which matches or exceeds its direct acute damage, reflects the importance of upstream dependencies in assessing physical risk exposure.
Historical events provide concrete evidence that physical climate risk can propagate through supply chains and critical infrastructure even when a firm's own assets remain largely unaffected. Hurricane Sandy (2012), for example, disrupted the operations of numerous financial institutions in New York through failures in electricity, telecommunications and data-centre infrastructure, highlighting the dependence of the financial sector on climate-exposed service providers and network infrastructure rather than on its own physical footprint[6]. Similarly, the 2011 Thailand floods disrupted a large share of global hard-disk-drive production, generating shortages and price increases that reverberated throughout the information and communication sector worldwide[7]. In both cases, the most significant impacts arose not from direct damage to the affected firms' facilities, but from disruptions affecting upstream suppliers and critical infrastructure. These events illustrate the central argument of this article: a company's climate exposure extends beyond the assets it owns to the broader production and service networks on which it depends.
Two sectors deserve a note of interpretation:
Real estate (L) records moderate direct damage (1.2%) despite a business model built on physical property, together with the highest supply chain component in the portfolio outside sector E (2.7%). This reflects the profile of the companies in the sample, which is dominated by real estate managers, agencies and service providers rather than by the underlying properties themselves. Their operations depend on construction, energy, maintenance and facility services. Property-level climate risk is real, but it is better captured by a dedicated real estate framework with its own hazard, retrofit and valuation mechanics. The results for sector L should therefore be read as describing real estate companies, not real estate assets.
Agriculture (A) records moderate direct damage (1.2%) despite being one of the most climate-sensitive sectors in the economy. This reflects the nature of agricultural value creation. Agricultural operations are exposed to damage affecting land, infrastructure and facilities, but a large share of climate-related losses arises through impacts on biological production systems, including crop yields, livestock productivity and water availability. This sensitivity enters the framework through the chronic channel (1.8%) and through the supply chain channel (1.6%). The supply chain component exceeds direct damage because agriculture itself depends on climate-exposed upstream inputs such as energy, fertilisers, animal feed and water infrastructure. The sector's climate sensitivity is also transmitted downstream, through the supply chain exposure of every sector that relies on agricultural outputs.
Key takeaways for Financial Institutions
The framework developed in this article, and the evidence from the case study, support three conclusions that are directly actionable for risk managers, investors and decision-makers.
1. Physical climate risk is not solely asset-level risk.
A company's climate exposure is the sum of three channels, chronic, acute and supply chain, and only the first two are visible from the company's own asset base. Facility-level assessment remains the necessary foundation, because hazards are local and two firms in the same sector can carry very different acute risk depending on where their sites are located. But it is not sufficient. Screening a portfolio on direct footprint alone systematically misclassifies firms: asset-light companies appear resilient precisely because the assets bearing their risk sit on someone else's balance sheet. In our case study, supply chain exposure accounts for more than two and a half times direct acute damage in financial services for instance. For investors, this means that exposure metrics built from owned facilities understate true exposure and understate it most for the firms that look safest.
2. Supply chain acts as a powerful transmission channel.
Upstream capacity losses do not stay upstream. Input-output linkages convert a drought in an agricultural region or a flood in an industrial cluster into procurement shortages, cost pressure and lost production for firms hundreds of kilometres from any hazard, and the strength of this transmission is measurable. In our portfolio, the supply chain channel exceeds direct acute damage in ten of the fifteen sectors, including asset-intensive activities such as mining. The practical implications differ by audience. For investors, supplier-network exposure belongs in due diligence and engagement: an issuer that cannot describe its upstream climate dependencies has not measured its risk. For corporates, resilience investment should be benchmarked against both channels. Hardening a factory against floods is of limited value if the plant then stands idle for lack of inputs, and while insurance can absorb part of the damage to owned facilities, disruptions at suppliers largely fall outside a company's own property coverage. Supplier diversification across geographies, inventory policy and contractual protections are climate-adaptation tools in the same sense as flood defences.
3. A complete climate risk framework combines facility-level hazard modelling, supply chain propagation and financial translation, and it can be built today.
The framework relies predominantly on publicly available inputs. Hazard maps and damage functions are public, scenario-consistent macroeconomic paths are public, and inter-country input-output tables are public. Because all three channels are expressed in the same unit, a share of EBITDA at risk, they consolidate into a single stressed measure. Through standard valuation approaches, this measure flows directly into credit risk models, from Merton-type default probabilities to stressed expected credit losses. Climate risk assessment does not need to wait for perfect data. It needs a coherent framework, and existing data already supports one
A company can protect every factory it owns and still remain exposed to climate risk. Across the portfolio analysed in this article, the indirect channel exceeds direct acute damage in most sectors, and it is largest where direct exposure looks smallest. For businesses whose value creation depends on networks of suppliers, from agricultural commodities in food manufacturing to energy and digital infrastructure in services, the supply chain can become the leading channel through which physical climate risk reaches financial performance. The general lesson extends beyond any single sector: the boundary of a firm's climate exposure is the boundary of its production network, not of its balance sheet. Institutions that measure only what they own will underestimate what they stand to lose.
How Forvis Mazars can help
The framework presented in this article is part of Forvis Mazars' proprietary suite of climate risk models. These models assess chronic, acute and supply chain risk within a single, consistent framework, and translate them into the metrics that matter for decision-making. They enable financial institutions, investors and decision makers to identify where climate risk sits in their portfolios, including the indirect exposures that facility-level assessments miss, and to integrate physical risk into credit risk management, stress testing and scenario analysis in line with evolving supervisory expectations, such as the Prudential Regulation Authority’s (PRA) Supervisory Statement (SS) 5/25.
| |
To discuss how these capabilities could apply to your portfolio or to explore any of the topics covered in this article in more detail, please feel free to contact us. Contact us |
Sources
[1] NGFS Climate Scenarios for central banks and supervisors - Phase V | Network for Greening the Financial System
[2] In technical terms, RCPs describe future greenhouse gas concentration trajectories, expressed as radiative forcing (W/m²) by 2100. The numeric value (e.g., 2.6, 4.5, 8.5) indicates the additional energy retained in the Earth system, which correlates with temperature rise: higher values mean greater warming.
[3] OECD, Inter-Country Input-Output (ICIO) Tables
[4] NACE (Nomenclature of Economic Activities): The official European Union industry classification system, commonly used in regulatory reporting, economic statistics, and risk analysis to group entities according to their primary economic activity.
[5] Results for sections E, I, M are based on smaller samples and should be interpreted in the context of the underlying sample composition
[6] Critical Infrastructure Systems: A case study of the interconnectedness of risks posed by Hurricane Sandy for New York City.
[7] Romero, J.J. (2012), The Lessons of Thailand's Flood: The Hard Drive Industry Shows that Responding to Disasters Can Be More Important than Preventing Them, IEEE Spectrum. and Bank of Thailand (2012), The Impact of the Flood in Thailand on the Global Supply Chain and the Future of HDD and Automotive Production Hubs in Thailand.